A €731K revenue decline at a 20-store retailer, traced from raw data to root causes,
management decisions, early warning, a 13-week forecast and an evidence-grounded AI assistant.
By Waleed Bin Umer · MSc Data Analytics, National College of Ireland
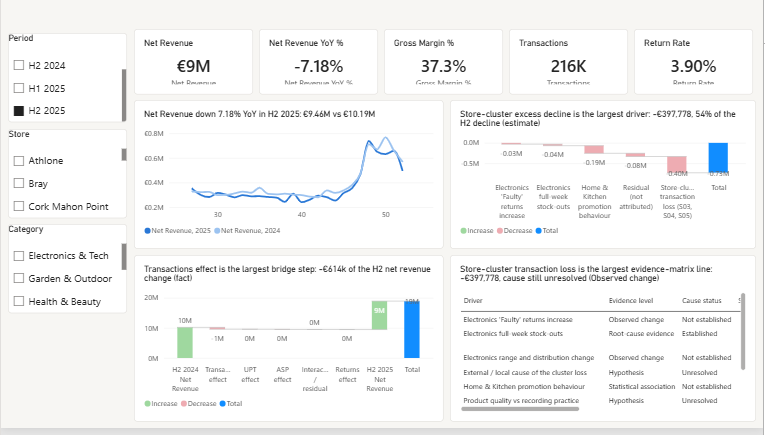
Of the decline from fewer transactions (Shapley revenue bridge)
20
Stores in Ireland
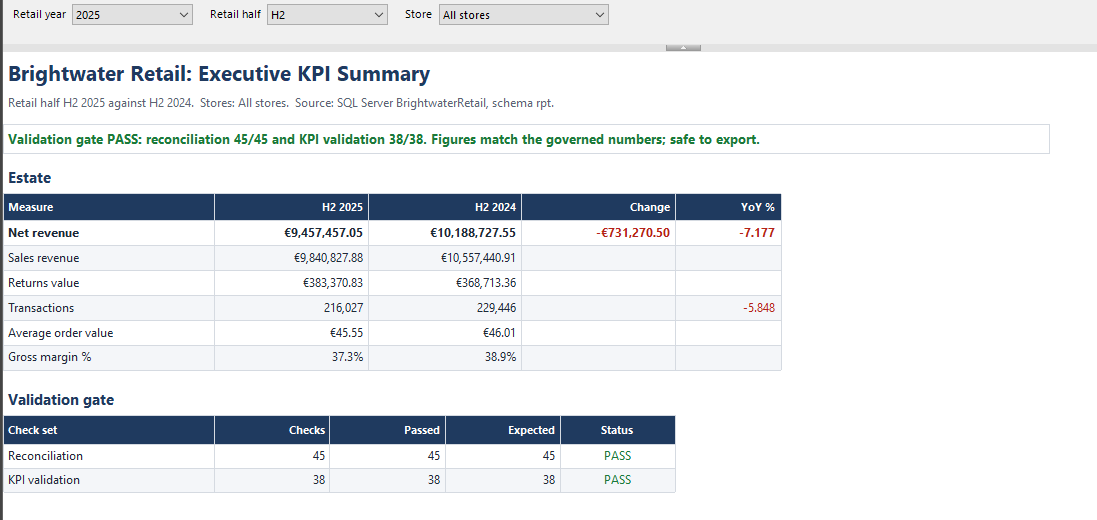
H2 2024 net revenue €10,188,727.55; H2 2025 net revenue €9,457,457.05.
The business question
Brightwater Retail runs 20 stores in Ireland. In the second half of 2025, net revenue fell against the same period of 2024. Management asked three questions:
Why did revenue fall?
Where did the problem start: which stores, categories, products and suppliers?
What should we do about it, and how would we spot it sooner next time?
The hard part is not finding a number that moved. It is separating what the data proves from what it only suggests, so that money is spent fixing real causes rather than guesses.
Key findings
Observed changecause: unresolved
Three stores account for over half of the decline
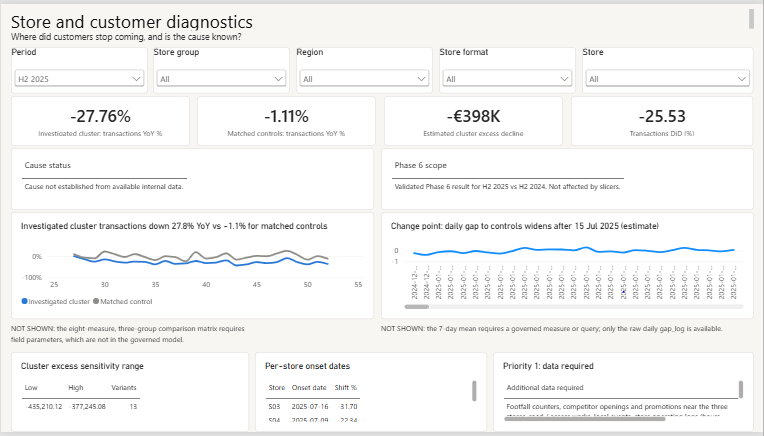
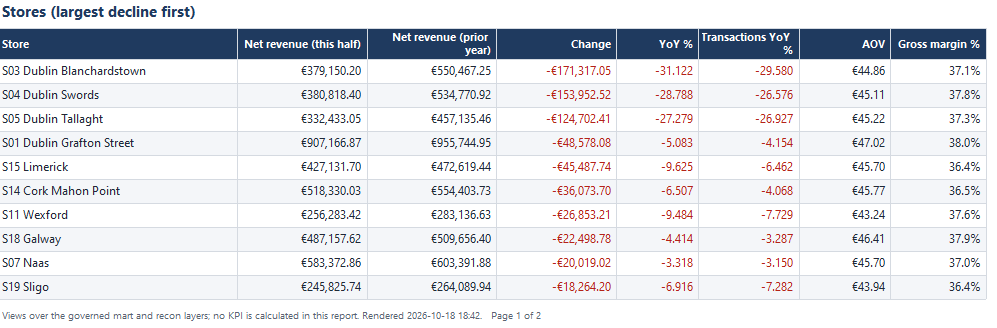
Stores S03, S04 and S05 lost about 27.8% of their transactions, against 1.1% for matched controls. A difference-in-differences estimate puts the excess decline at €397,778 (54% of the total), range €377,245 to €435,210. Footfall, competitor and store-operations data were not available, so the cause is not established.
Root-cause evidencecause: established
Electronics stock-outs cost measurable sales
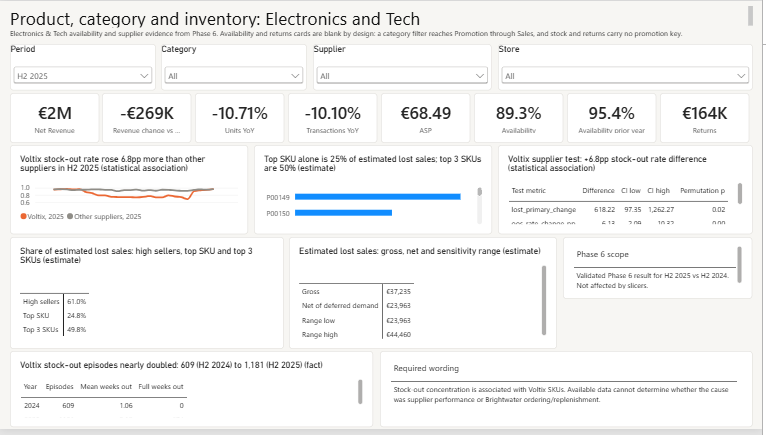
Electronics & Tech availability fell from 95.4% to 89.3%, mostly on Voltix-supplied products. Estimated lost sales were about €37,235 gross and €23,963 net (range €23,963 to €44,460). Whether the supplier or the retailer's ordering is responsible is not established.
Observed changecause: not established
“Faulty” returns rose, but that does not prove defects
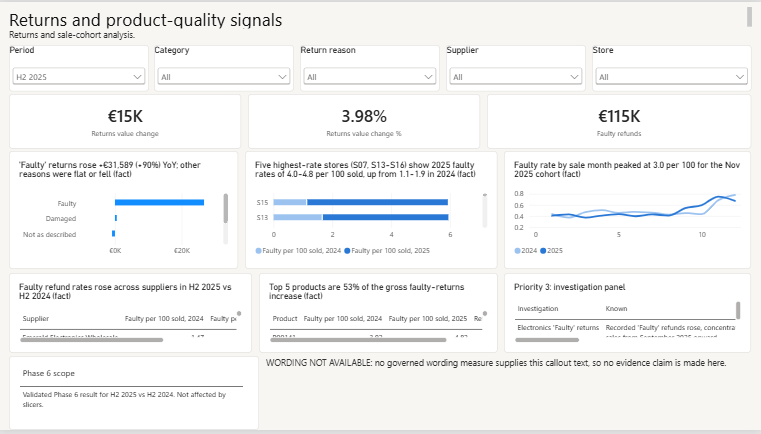
Refunds recorded with the till reason “Faulty” rose by €31,589 (+90%), concentrated in five stores. A till reason is not a verified defect; QA and batch data would be needed.
Statistical associationcause: not established
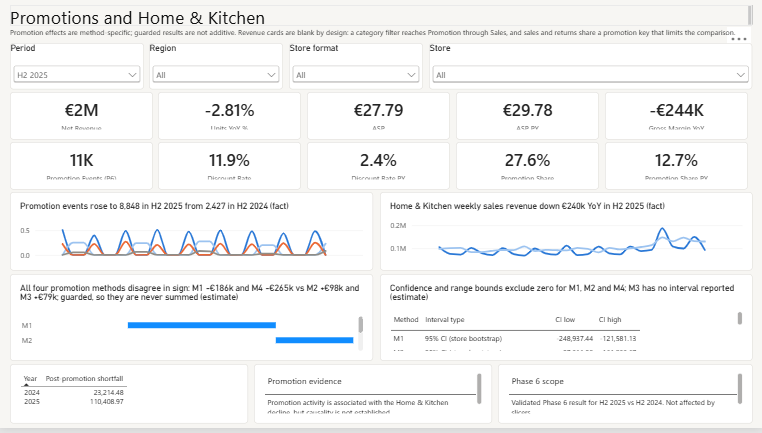
Home & Kitchen promotions are associated with the decline, not proven to cause it
The discount rate rose from about 2.4% to 11.9%. Four estimation methods disagree in sign, so they are reported separately and never added together.
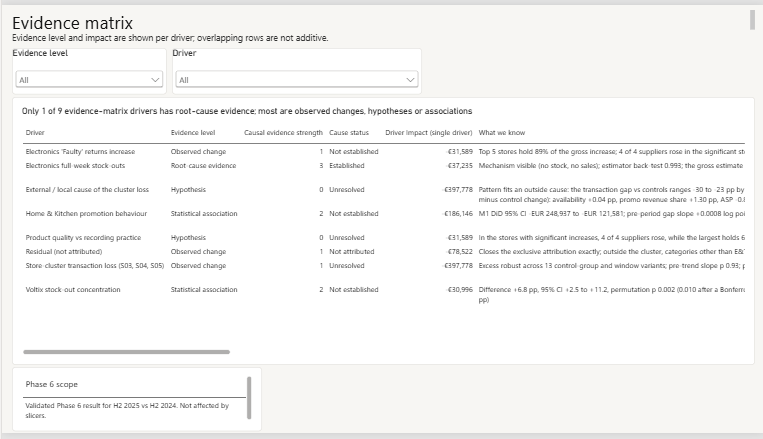
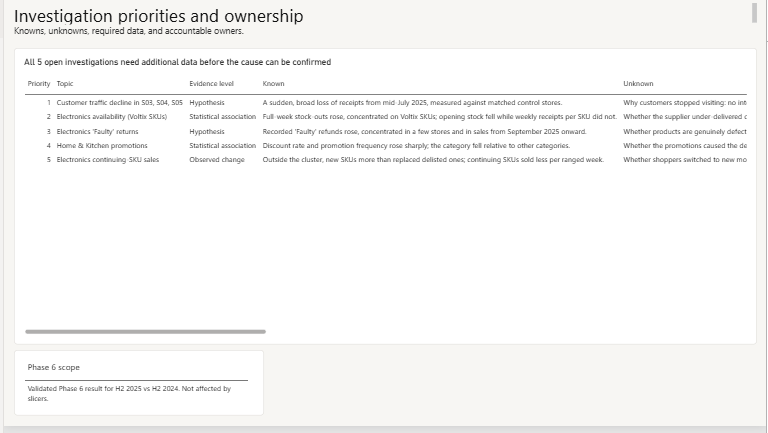
Financial size sets investigation priority; evidence strength sets what action is justified.
The Power BI dashboard
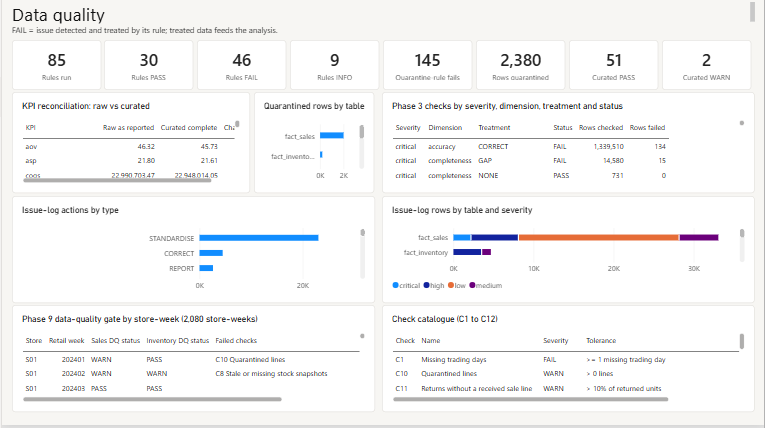
Nine report pages, generated from code and validated in Power BI Desktop. Select a page to enlarge it.
1 Executive overview2 Store and customer diagnostics3 Product, category and inventory4 Returns and quality signals5 Promotions and Home & Kitchen6 Evidence matrix7 Investigation priorities8 Forecast9 Data quality
Paginated report
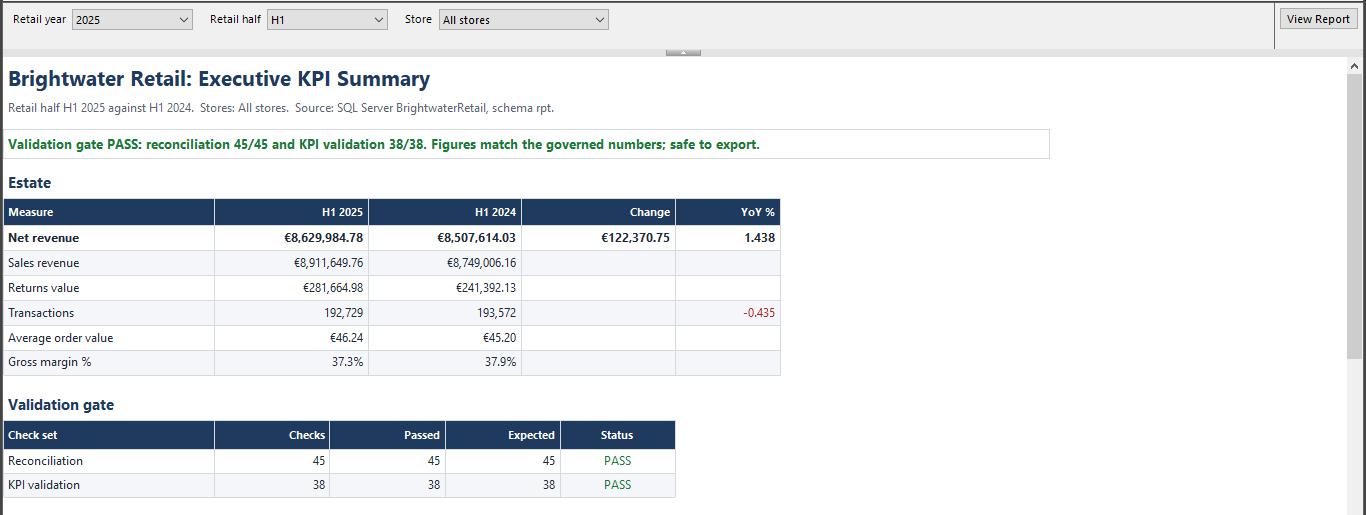
A print-ready Executive KPI Summary built in Power BI Report Builder on the SQL Server warehouse. It reads
thin views over the governed KPI layer, takes cascading Year/Half parameters and a store parameter, and opens with a validation
gate (reconciliation 45/45, KPI validation 38/38). The H2 2025 export reconciles to €9,457,457.05
(−7.18%), and the store rows sum to the estate total.